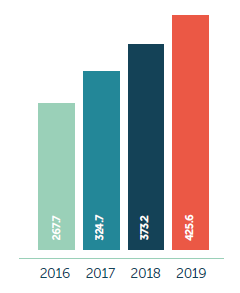
Group revenues increased by
14%
to £425.6 million
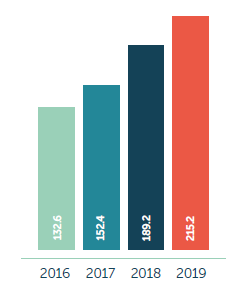
Recurring revenues increased by
14%
to £215.2 million
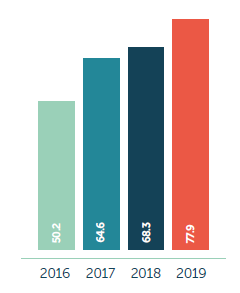
Group EBITDA increased by
15%
to £89.1 million
EBITDA margin maintained at
21%
Closing order book increased to
£846.9m
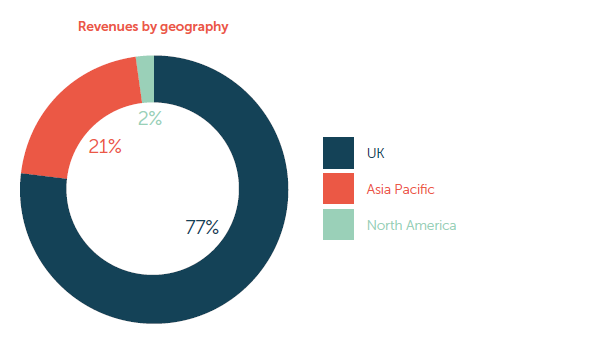
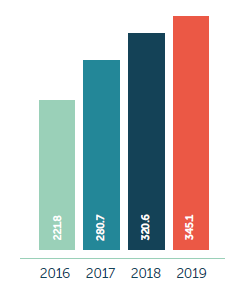
During the year to 30th September 2019 Group revenues grew by 14% overall to £425.6 million (2018: £373.2 million). Total net revenues increased to £345.1 million.
We’ve now produced growth of 90% in net revenues since 2015, as we continue to create value for all stakeholders through our established position as a global leader in software for public services.
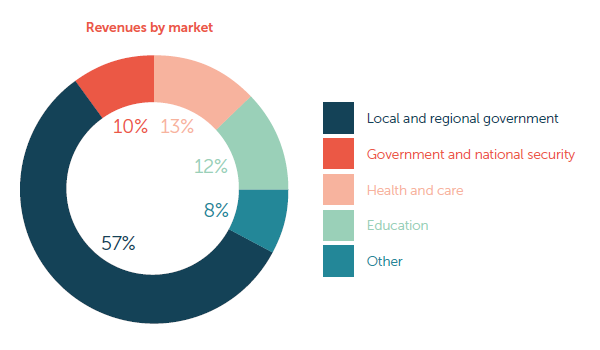
Overall we signed a record number of major sales in the year with the volume increased by 17% per cent - two thirds of these were cloud-based.
Recurring revenues grew 14% overall, increasing to 56% of net revenues and supporting improved visibility and predictability of income. Our software IP and implementation revenues improved by 17%.